Overview
As my homelab expanded from a single Raspberry Pi 5 into multiple Proxmox nodes, I needed a reliable way to measure the actual network performance between them. A link negotiating at 2.5 GbE does not necessarily mean that applications can transfer data at the same rate. Cabling, network adapters, switching, virtualization, container networking and host load can all affect the final result.
I built a centralized LAN speed monitoring system using iperf3, InfluxDB and Grafana. The Raspberry Pi, named rpi5, is the central collector and reference point. It runs scheduled throughput tests against three peer Proxmox LXCs: proxmox-asus, proxmox-pc and proxmox-router. Results are written to InfluxDB on the Pi and displayed through a live Grafana dashboard.
Every speed is shown relative to rpi5. Upload means traffic from the Pi to an endpoint, while download means traffic from an endpoint back to the Pi.
Why I Built This
The homelab contains storage, backup, AI, Kubernetes, media and infrastructure workloads distributed across several physical machines. Network performance directly affects VM backups, NAS replication, container image transfers, media access and movement of AI models or datasets.
The main goals of this project were to:
- Verify that the upgraded LAN could sustain close to 2.5 GbE in both directions.
- Measure the path between the Raspberry Pi and each endpoint rather than relying only on interface link speed.
- Identify asymmetric routes where one direction performs differently from the other.
- Keep historical results so that cabling, adapter or switch problems can be detected over time.
- Monitor route availability in addition to throughput.
- Run the monitoring services through Portainer using repeatable Docker Compose stacks.
- Store all persistent application data under a single directory for easier backup and migration.
Existing Homelab Hardware
The monitoring system spans the central Raspberry Pi and three peer Proxmox LXCs. Every endpoint generates or consumes enough network traffic to make Pi-to-endpoint testing useful.
| Node | Hardware | Storage | Primary Role |
|---|---|---|---|
| ASUS Proxmox | ASUS NUC 14 Pro Plus, Core Ultra 5 125H, 64 GB DDR5-4800 | 2 TB Corsair NVMe, 4 TB Samsung 990 Pro | Primary NAS, infrastructure services, applications and testing |
| PC Proxmox | Custom PC, Core Ultra 7 265K, 64 GB DDR5-6000, RTX 3060 12 GB | 1 TB WD Blue NVMe, 8 TB Seagate IronWolf | AI workloads, NAS backup, Kubernetes and experimentation |
| Router Proxmox | Proxmox LXC (proxmox-router) |
Storage managed by its Proxmox host | iperf3 monitoring endpoint |
| Raspberry Pi | Raspberry Pi 5, 8 GB RAM | 256 GB SATA SSD, 1 TB + 1 TB + 2 TB HDD | Network services, VPN, reverse proxy and backup copy |
The three Proxmox endpoints—proxmox-asus, proxmox-pc and proxmox-router—are all LXCs and participate in monitoring in the same way. The monitored paths are capable of 2.5 GbE. The Raspberry Pi uses a 2.5 GbE network interface, while the Proxmox hosts connect through their 2.5 GbE interfaces.
Network Topology
The physical nodes are connected to the same local network through the ISP router and an unmanaged switch. DHCP reservations provide consistent addresses, while AdGuard Home and Unbound provide internal DNS resolution for infrastructure names.
                         Internet
                            │
                       ISP Router
                  Gateway, DHCP and routing
                            │
                    Unmanaged LAN Switch
          ┌─────────────────┼─────────────────┬─────────────────┐
          │                 │                 │                 │
  Raspberry Pi 5       Proxmox LXC       Proxmox LXC       Proxmox LXC
  rpi5 collector       proxmox-asus      proxmox-pc       proxmox-router
The measurement paths are Pi-centered:
rpi5 <-> proxmox-asus
rpi5 <-> proxmox-pc
rpi5 <-> proxmox-router
The iperf3 endpoints use these internal names:
| Endpoint | Role |
|---|---|
rpi5 |
Central collector, InfluxDB and Grafana node |
proxmox-asus |
Peer iperf3 server running in a Proxmox LXC |
proxmox-pc |
Peer iperf3 server running in a Proxmox LXC |
proxmox-router |
Peer iperf3 server running in a Proxmox LXC |
Every name must resolve from inside the Docker containers. I use internal DNS where possible and Docker extra_hosts mappings as a fallback.
Software Stack
The system uses five main components:
| Component | Purpose |
|---|---|
| iperf3 | Generates controlled TCP traffic and returns detailed JSON results |
| Collector | Runs scheduled tests, parses the JSON output and writes metrics to InfluxDB |
| InfluxDB 2 | Stores throughput, health, retransmit and timing data as time-series measurements |
| Grafana | Queries InfluxDB and displays route history, latest speed and health |
| Portainer | Deploys and manages the central Docker Compose stack on the Pi |
The collector, InfluxDB and Grafana are centralized on rpi5. Each Proxmox LXC runs an iperf3 server on TCP port 5201. The Pi initiates every test; the endpoint LXCs do not test one another or write directly to InfluxDB.
Central Node Measurement Model
For each destination, the collector performs a normal iperf3 test for upload and a reverse test for download. Both labels are defined from the central Pi’s perspective:
proxmox-asus upload      = rpi5 → proxmox-asus
proxmox-asus download    = proxmox-asus → rpi5
proxmox-pc upload        = rpi5 → proxmox-pc
proxmox-pc download      = proxmox-pc → rpi5
proxmox-router upload    = rpi5 → proxmox-router
proxmox-router download  = proxmox-router → rpi5
Three destinations with two directions each produce six dashboard series:
3 endpoints × 2 directions = 6 seriesThis model deliberately measures only paths that start or end at rpi5. It does not claim to measure traffic directly between two Proxmox LXCs.
Test Scheduling
The central collector tests one endpoint and one direction at a time so the measurements do not compete for bandwidth. For each endpoint it runs an upload test followed by a reverse download test, then moves to the next endpoint.
Each TCP test runs for five seconds with one parallel stream. Six sequential tests require roughly 30 seconds plus connection overhead. TEST_INTERVAL=60 starts a cycle about once per minute when the work finishes within that interval.
The main collector settings are:
IPERF_PORT: 5201
IPERF_DURATION: 5
IPERF_PARALLEL: 1
TEST_INTERVAL: 60
In the single-file Portainer stack, the central collector configures all three Proxmox LXC targets identically:
collector:
  environment:
    IPERF_TARGETS: proxmox-asus,proxmox-pc,proxmox-router
    IPERF_PORT: ${IPERF_PORT:-5201}
    IPERF_DURATION: ${IPERF_DURATION:-5}
    IPERF_PARALLEL: ${IPERF_PARALLEL:-1}
    TEST_INTERVAL: ${TEST_INTERVAL:-60}
  extra_hosts:
    - "proxmox-asus:192.168.1.30"
    - "proxmox-pc:192.168.1.37"
    - "proxmox-router:192.168.1.22"
The extra_hosts entries are only a DNS fallback. If all three names resolve through LAN DNS from inside the collector container, the mappings can remain disabled.
Data Collection
iperf3 runs in JSON mode so the collector does not need to parse human-readable terminal output:
iperf3 --client proxmox-asus \
  --port 5201 \
  --time 5 \
  --parallel 1 \
  --connect-timeout 5000 \
  --json
For every successful test, the collector writes the following values to the iperf3 measurement:
- Destination and direction tags
- Protocol
- Bits per second
- Megabits per second
- Bytes transferred
- Test duration
- TCP retransmits
- Collector runtime
- Reachability status
Failures are also stored with status=0 and a shortened error message. This allows the same dashboard to show both performance and connectivity problems.
A simplified InfluxDB point looks like this:
iperf3,destination=proxmox-asus,direction=upload,protocol=tcp \
status=1i,megabits_per_second=2357.0,retransmits=3i
Portainer Deployment
The supplied single-file Portainer stack runs InfluxDB, Grafana and the collector on the Raspberry Pi. Its collector tests proxmox-asus, proxmox-pc and proxmox-router in both upload and download directions. Each Proxmox LXC only needs a reachable iperf3 server on TCP port 5201.
All persistent central data is stored below:
/home/pi/docker/lan-speed/data/
├── grafana/
├── grafana-config/
├── influxdb/
└── influxdb-config/
I used direct bind paths in the Compose configuration rather than a top-level named volumes section. This keeps every persistent file inside one predictable directory.
The central services use these environment values:
INFLUX_URL=http://influxdb:8086
INFLUXDB_ORG=home
INFLUXDB_BUCKET=lan_speed
INFLUXDB_TOKEN=REDACTED
The token is configured through Portainer environment variables and is not stored in the published configuration. The collector writes all results locally to InfluxDB; the endpoint LXCs do not need the token. TCP port 5201 and the InfluxDB endpoint remain restricted to the trusted local network.
Grafana Dashboard
Grafana is provisioned automatically with the InfluxDB data source and LAN-speed dashboard:
- LAN throughput — throughput history for each destination and direction.
- Target health — whether the latest test reached the selected endpoint.
- TCP retransmits — retransmits accumulated over the selected time range.
Destination and Direction variables can show all six Pi-centered series or narrow the dashboard to one endpoint or direction. In every legend entry, upload means rpi5 to the named destination and download means the named destination to rpi5.
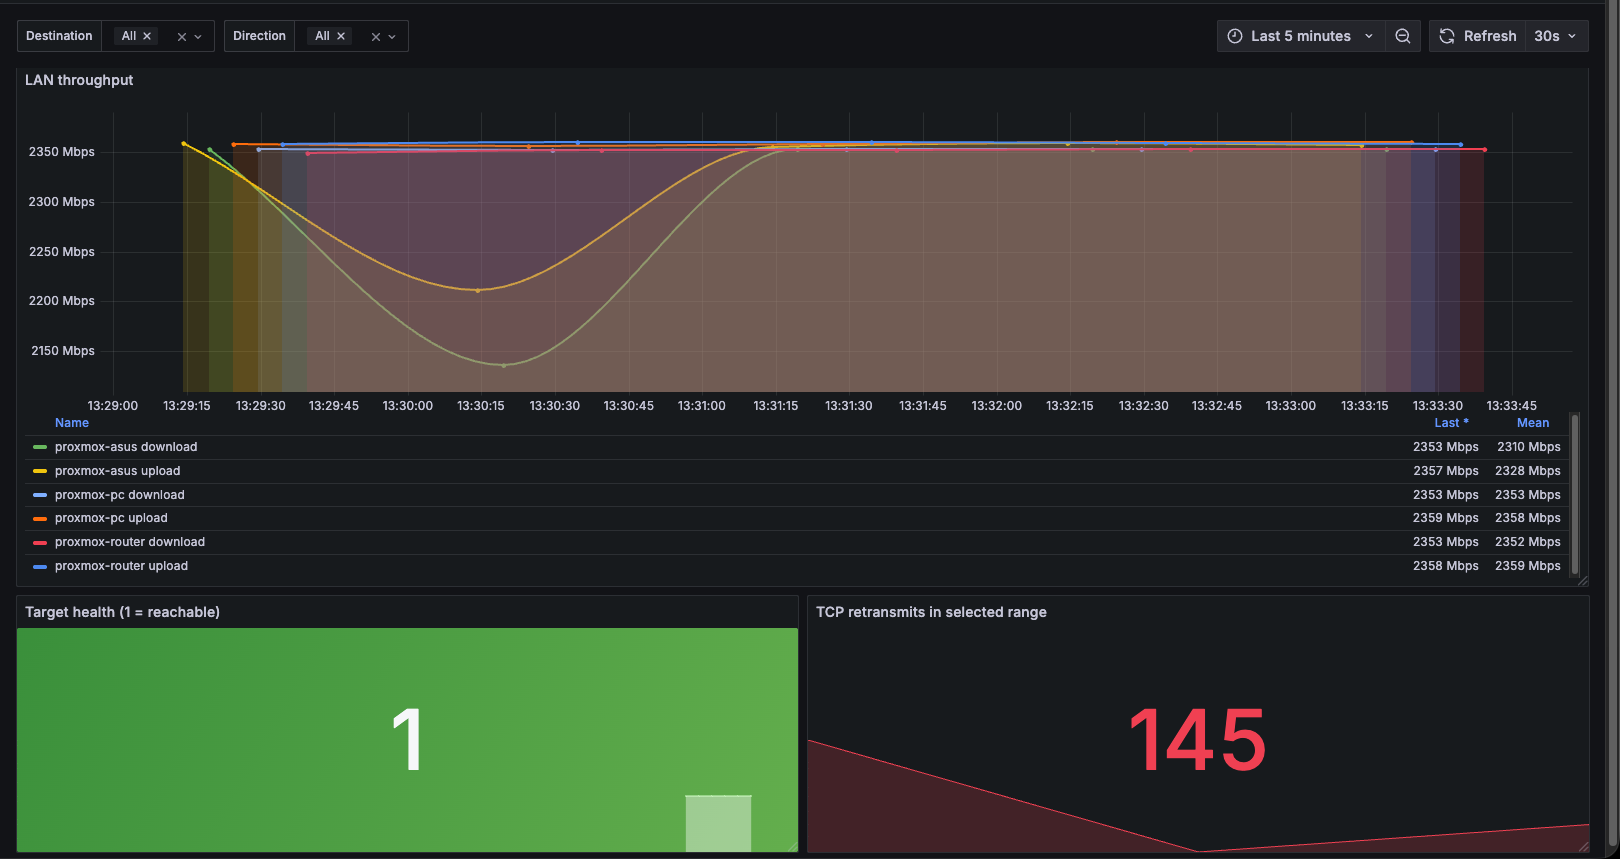
The dashboard view above shows the three peer LXCs sustaining approximately 2.35 Gbps in both directions relative to the Raspberry Pi. Target health is reachable, and the retransmit panel shows the total for the selected five-minute range.
The dashboard refreshes every 30 seconds. InfluxDB remains the source of truth, so the time range can be expanded to compare current performance against previous hours or days.
Results
The dashboard screenshot shows these latest and mean values. Every route is written from the central Pi’s perspective:
| Endpoint | Direction relative to rpi5 |
Path | Latest | Mean |
|---|---|---|---|---|
proxmox-asus |
Download | proxmox-asus → rpi5 |
2353 Mbps | 2310 Mbps |
proxmox-asus |
Upload | rpi5 → proxmox-asus |
2357 Mbps | 2328 Mbps |
proxmox-pc |
Download | proxmox-pc → rpi5 |
2353 Mbps | 2353 Mbps |
proxmox-pc |
Upload | rpi5 → proxmox-pc |
2359 Mbps | 2358 Mbps |
proxmox-router |
Download | proxmox-router → rpi5 |
2353 Mbps | 2352 Mbps |
proxmox-router |
Upload | rpi5 → proxmox-router |
2358 Mbps | 2359 Mbps |
All three endpoints are generally around 2.35 Gbps in both directions. This is consistent with expected application throughput on a 2.5 GbE link after Ethernet, IP and TCP overhead. The lower ASUS means reflect the temporary dips visible early in the selected five-minute window rather than a lower latest speed.
The result confirms end-to-end throughput rather than only interface negotiation. It verifies that the network adapters, cabling, switch path, operating systems and container networking can collectively sustain near-line-rate traffic.
Challenges & Solutions
Portainer Build Context
My first Compose stack referenced local collector/ and grafana/ build directories. When I pasted only the Compose file into Portainer’s Web Editor, deployment failed because those directories did not exist in Portainer’s stack workspace.
I solved this by creating a self-contained Web Editor stack based on official images. The collector and Grafana provisioning files are generated when the containers start, removing the dependency on external build contexts. Repository-based deployment remains an option when all project directories are committed together.
Container Name Resolution
Hostnames that resolve on the Docker host do not always resolve inside containers, and containers do not automatically inherit custom entries from the host’s /etc/hosts file.
I configured the collector to use the internal DNS names proxmox-asus, proxmox-pc and proxmox-router. It also has optional extra_hosts mappings for all three destinations when LAN DNS is unavailable inside Docker.
Misleading Raspberry Pi Result
The first dashboard showed the rpi5 route at approximately 41-46 Gbps. That was not real LAN throughput. The collector was testing an iperf3 server on the same physical Pi, so the traffic stayed inside the host and measured the loopback or container networking path rather than the Ethernet interface.
This result demonstrated why endpoint placement matters. A device cannot accurately measure its own physical LAN performance by connecting back to itself. I removed rpi5 from IPERF_TARGETS, leaving only the three Proxmox LXCs, so every recorded test crosses the Pi’s physical network interface.
Understanding Retransmits
The retransmit panel displays a large value because it sums retransmits across every destination, direction and test in the selected time range. I treat this as a range total rather than a current status value. The Destination and Direction filters make it easier to isolate a specific Pi-to-endpoint path.
Operational Considerations
iperf3 generates real traffic and temporarily consumes most of the available bandwidth on the tested path. A short interval is useful for initial validation, but continuous production monitoring should balance visibility against network load.
For normal operation I use short five-second tests, sequential execution and a one-minute cycle. The interval can be increased when the network is busy or when long-term trend monitoring is more important than rapid detection.
I also keep Grafana, InfluxDB and iperf3 restricted to the LAN. None of their ports need to be exposed directly to the public internet.
Conclusion
This project turned a collection of manual iperf3 commands into a centralized monitoring system that continuously measures the real performance between rpi5 and three peer Proxmox LXCs.
InfluxDB provides historical storage, while Grafana makes endpoint and direction differences immediately visible. Defining every speed relative to the central Pi makes the dashboard unambiguous: upload is rpi5 → endpoint and download is endpoint → rpi5. The measured throughput of approximately 2.35 Gbps confirms that all three monitored paths are operating close to the practical limit of 2.5 GbE.
More importantly, the project exposed issues that a simple link-speed check would not reveal, including loopback measurements, container DNS behavior, deployment context and the effect of simultaneous tests. It now provides a reusable foundation for detecting performance regressions as the homelab network, storage systems and workloads continue to evolve.